Troubleshooting
Troubleshooting
Section titled “Troubleshooting”The single most useful thing you can do when something feels off: open the Output log and read it. The SDK speaks to you there.
Show the Godot Output log
Section titled “Show the Godot Output log”The Output log is where Quest Data prints what it’s doing — successful batches, fetch errors, “Backend unreachable”, parse warnings. If you don’t see it, you’re flying blind.
Inside the editor
Section titled “Inside the editor”There are two panels and they show different things:
| Panel | Shows | How to open |
|---|---|---|
| Output | print() statements + push_warning (yellow) | Bottom dock, Output tab. If hidden: View → Bottom Panel → Output (or Ctrl/Cmd-Alt-O) |
| Debugger → Errors | push_error (red) — including SDK “Backend unreachable” | Bottom dock, Debugger tab → Errors sub-tab. Auto-pops when an error fires unless you disabled it in Debug → Settings. |
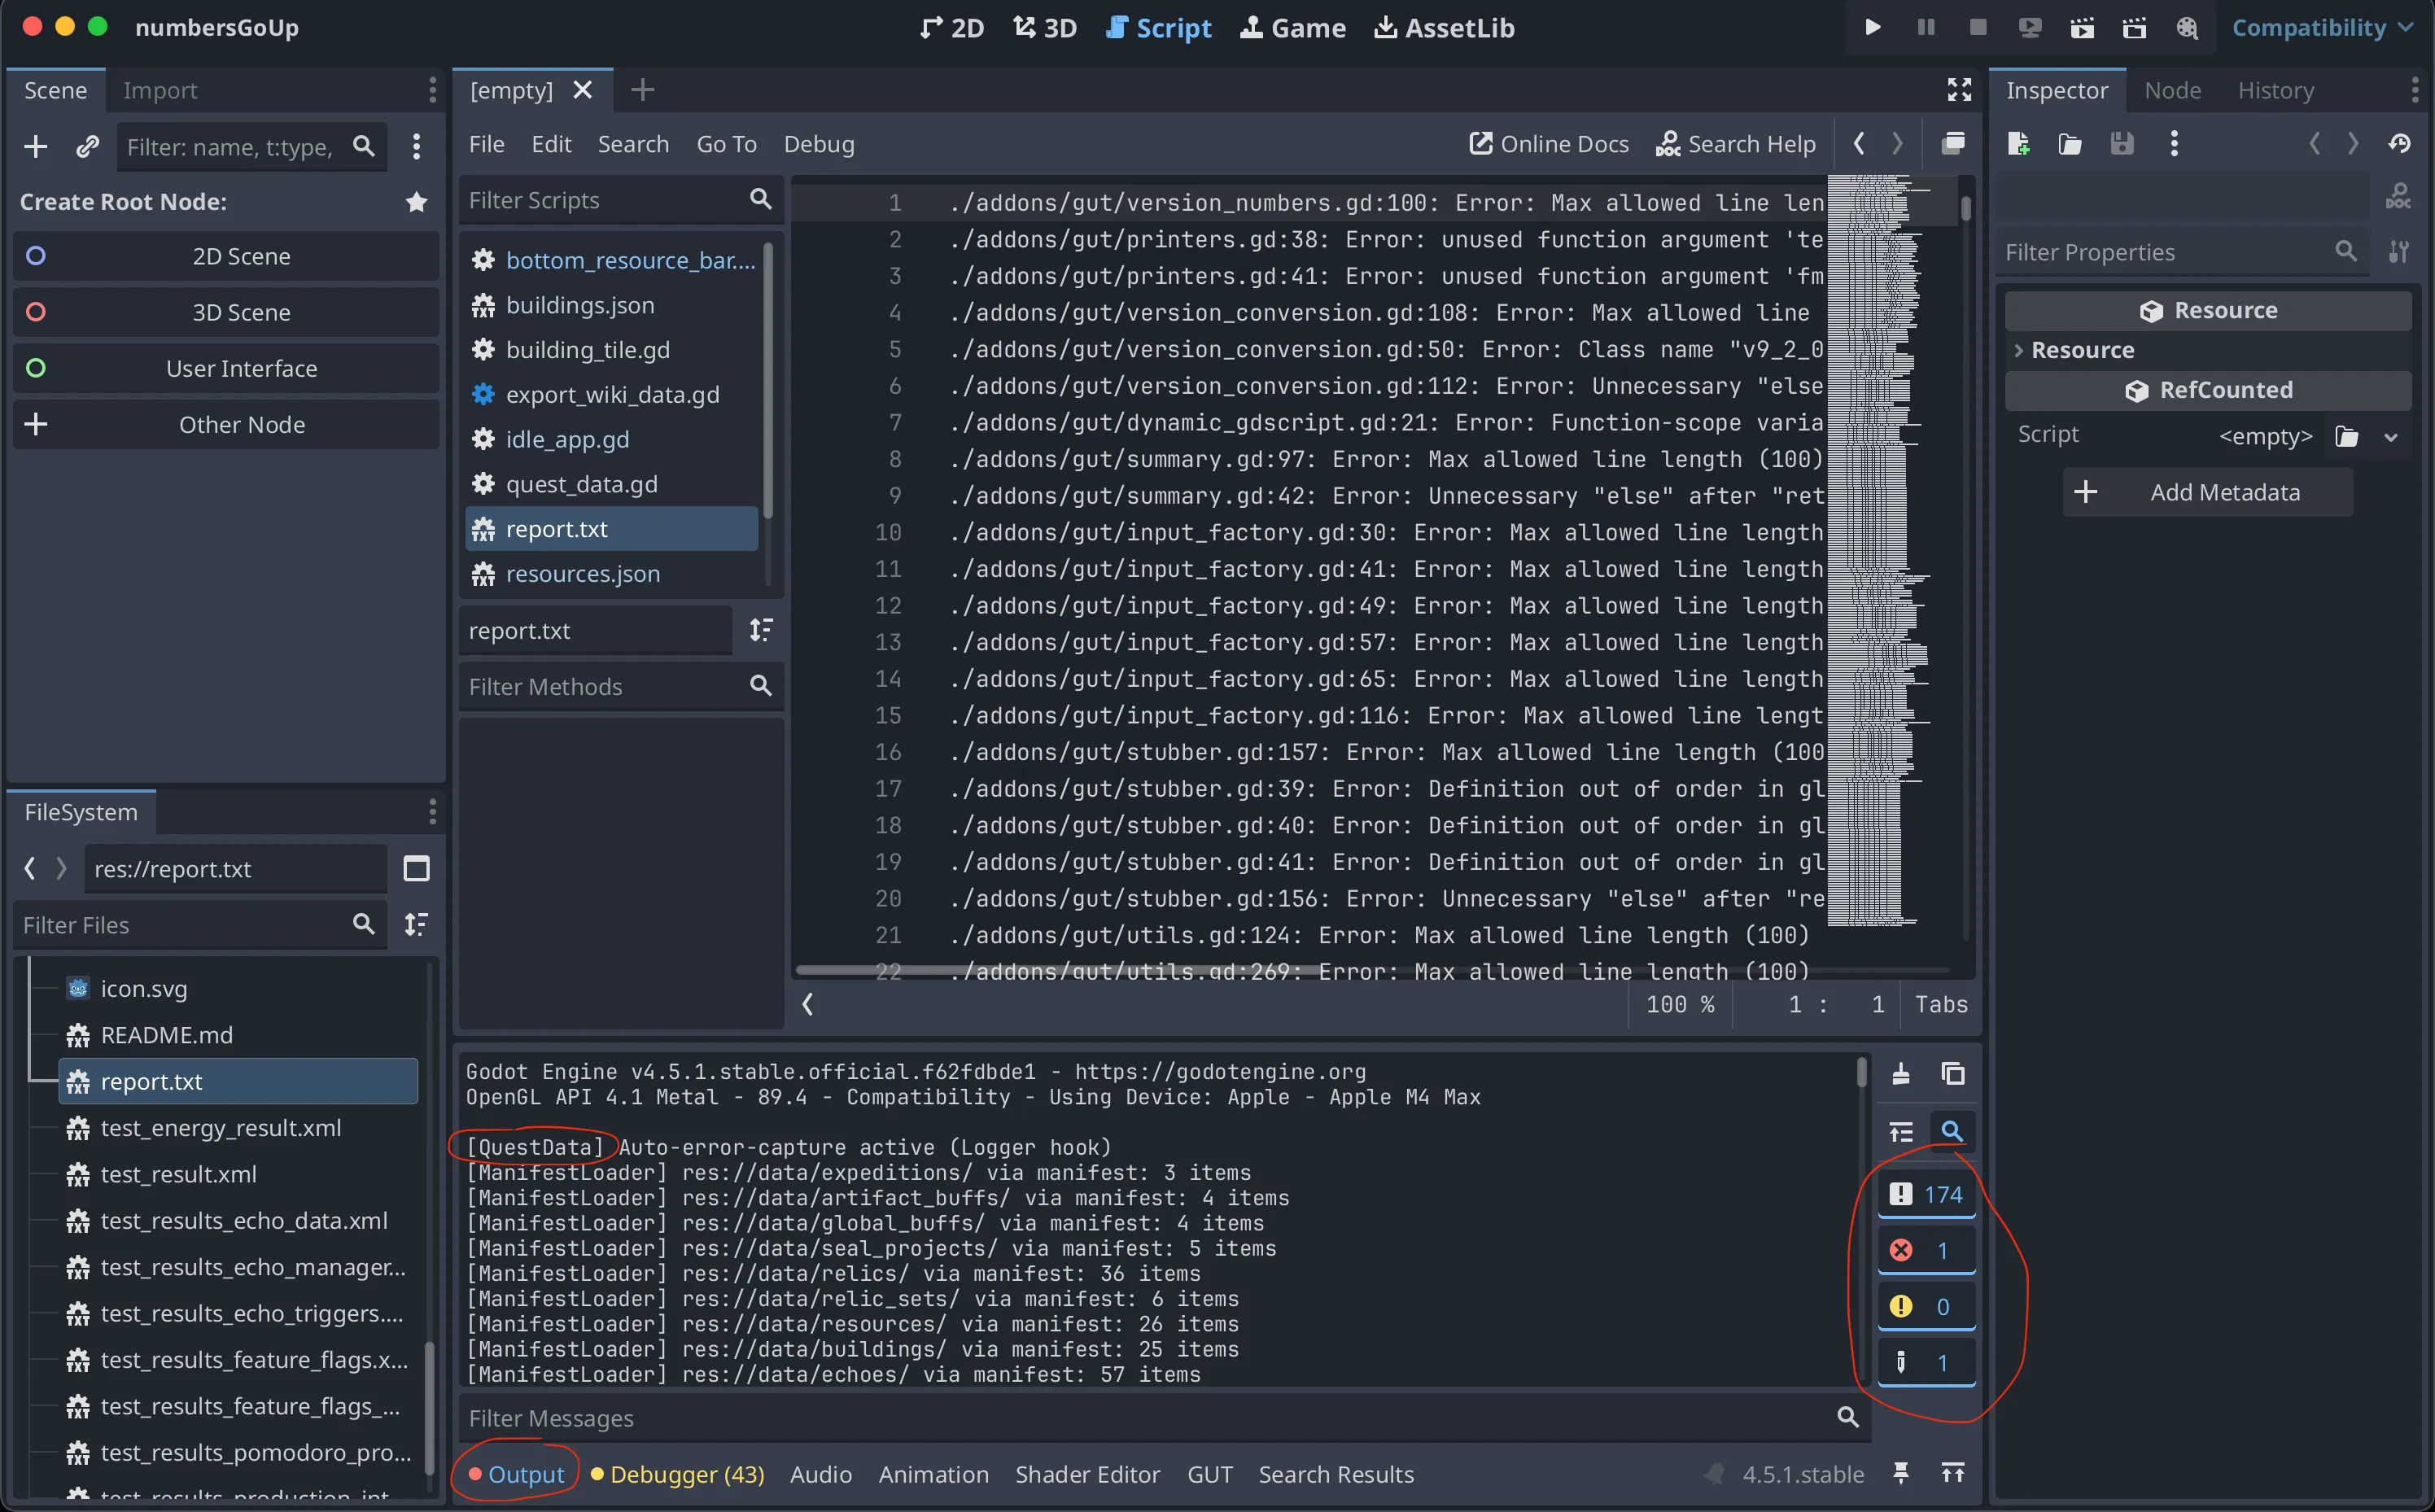
The little counter badges on the right edge of the bottom dock are your at-a-glance status: red number = push_error count, yellow = push_warning, blue = print. If the red badge ticks up after launching your game, click it to jump straight to the error list.
Tip: dock both side-by-side. The SDK uses print for routine info, push_warning for recoverable issues, and push_error for things you almost certainly want to fix (wrong API key, dead backend URL, etc.).
Exported / standalone build (player runs the binary)
Section titled “Exported / standalone build (player runs the binary)”The Output panel is editor-only. For an exported build:
- Windows / Linux: launch from a terminal —
printandpush_*go to stdout/stderr. On Windows you can also tick Project → Export → Resources → Embed PCK off and ship a.console.exewrapper that opens a console window. - macOS: run the
.appbundle from Terminal:./MyGame.app/Contents/MacOS/MyGame - Android:
adb logcat | grep godot - iOS: Xcode console while attached, or Window → Devices and Simulators → View Device Logs
In a release build you can also use Quest Data’s own dashboard: Live Activity + Logs show events and remote-logged errors in near-real-time, no terminal required. (Requires QuestData.log_*() calls or auto_capture_errors=true.)
Increase SDK verbosity in dev
Section titled “Increase SDK verbosity in dev”Default log level is info. Crank it up while debugging:
# In a debug autoload, before any other QuestData call:QuestData.set_log_level("debug") # debug | info | warning | errorYou’ll start seeing “Batch sent successfully”, “Config fetched (12 keys)”, “GameData cache hit for table=buildings”.
Backend unreachable
Section titled “Backend unreachable”Symptom (red push_error in Output / Debugger):
[QuestData] Backend unreachable (track): Cannot connect to host — api_url=http://localhost:3010/v1/track Check ProjectSettings → quest_data/dev_api_url + network. Further outage messages suppressed until next successful request.What it means: the SDK tried to reach the API server and never got a response — wrong URL, server down, DNS broken, firewall blocking, no internet, or VPN/proxy interfering. The error fires once per outage; it stays quiet on subsequent flush ticks (every 10s) so it doesn’t spam your Output, and re-arms automatically the moment a request succeeds.
The (track) / (remote_config) / (game_data) label tells you which subsystem first noticed.
Solutions:
- Check the URL it printed — copy the
api_url=…value, paste intocurlor your browser:Expected:Terminal window curl -i http://localhost:3010/v1/healthz200 OK. Anything else = server side problem. - Verify the project setting — Project → Project Settings → Advanced, search
quest_data/dev_api_url(debug builds) orquest_data/prod_api_url(release). Trailing slash? Wrong port? Typo? Missing/v1/tracksuffix? - Backend not started — run
docker compose up(locally) or check VPS status. - DNS (
Cannot resolve hostname) — wrong domain, or you’re offline. - TLS handshake error — usually self-signed cert in dev. Set
dev_api_urltohttp://nothttps://for localhost. - Timeout — server is alive but slow. Default timeout is 10s; check if a long-running migration / cold container is the cause.
It happens only once. So how do I confirm “yes, still down”? Look at QuestData.dump_state() — event_queue.queue_size keeps growing while batches fail; that’s your real-time outage indicator.
Plugin not loading
Section titled “Plugin not loading”Symptom: QuestData.track() returns error “Undefined identifier” or “Function call not allowed in constant expression”.
Solutions:
-
Verify plugin is enabled: Project → Project Settings → Plugins.
-
Check that
addons/quest_data/plugin.gdexists. -
Restart Godot completely.
-
Check console for errors: View → Toggle Console.
-
Call
QuestData.track()only inside functions, never at script top-level. GDScript follows the same rule as Java/C#: function calls must live inside other functions. At the top level of a.gdfile you can only declare variables, constants and signals — not execute calls. The error looks like a missing identifier but is actually a parse-time scope error.# ❌ WRONG — top-level call, autoload not ready yet, parser rejects itextends NodeQuestData.track("game_start") # error here# ✅ CORRECT — wrap in _ready() (or any other function)extends Nodefunc _ready() -> void:QuestData.track("game_start")
Events not appearing in dashboard
Section titled “Events not appearing in dashboard”Symptom: Track events fire (no errors), but the dashboard shows no data.
Solutions:
- Check the API key:
print(ProjectSettings.get_setting("quest_data/api_key"))
- Verify API URL ends without trailing slash:
https://quest-api.digitalfactory.at, not…/. - Check network — SDK logs to console on error (see Backend unreachable above).
- Wait ~15 seconds — SDK batches events every 10s, plus server processing latency.
- Look at the dashboard’s own logs — Configuration → Logs surfaces every API error the backend saw, including which API key fired it.
- Check your queue size:
Growing = nothing’s being shipped. Static at 0 = events are leaving the SDK; problem is server-side.print("queued events: ", QuestData.get_queue_size())
Offline fallback not working
Section titled “Offline fallback not working”Symptom: Game crashes when network is disconnected.
Solutions:
- SDK handles offline gracefully by default — events queue to
user://quest_events.saveand replay on next successful flush. - Check that
user://is writable (some sandboxed mobile setups restrict it). - Verify events are queued:
QuestData.get_queue_size()— should grow while offline, drain back to 0 once online.
Where to look when nothing helps
Section titled “Where to look when nothing helps”If the Output log is silent and dump_state() looks healthy but data still isn’t where you expect it, dump full SDK state into a bug report:
print(JSON.stringify(QuestData.dump_state(), " "))That single dictionary contains: API URL, queue sizes, in-flight requests, fetched-config metadata, session ID, player ID, last error codes, freshness timestamps. Copy that into a GitHub Issue and we can usually diagnose without seeing your code.