Analytics & Insights
Analytics answers the most important question in game development: what are players actually doing? Without data, you’re guessing. With Quest Data, you see exactly where players get stuck, where they leave, and what keeps them coming back.
What You’ll Learn
Section titled “What You’ll Learn”- How to read the dashboard overview
- What retention numbers mean and when to worry
- How to build funnels that reveal drop-off points
- Where players die on your map (heatmaps)
- Which features nobody uses (engagement)
- What devices are causing performance issues
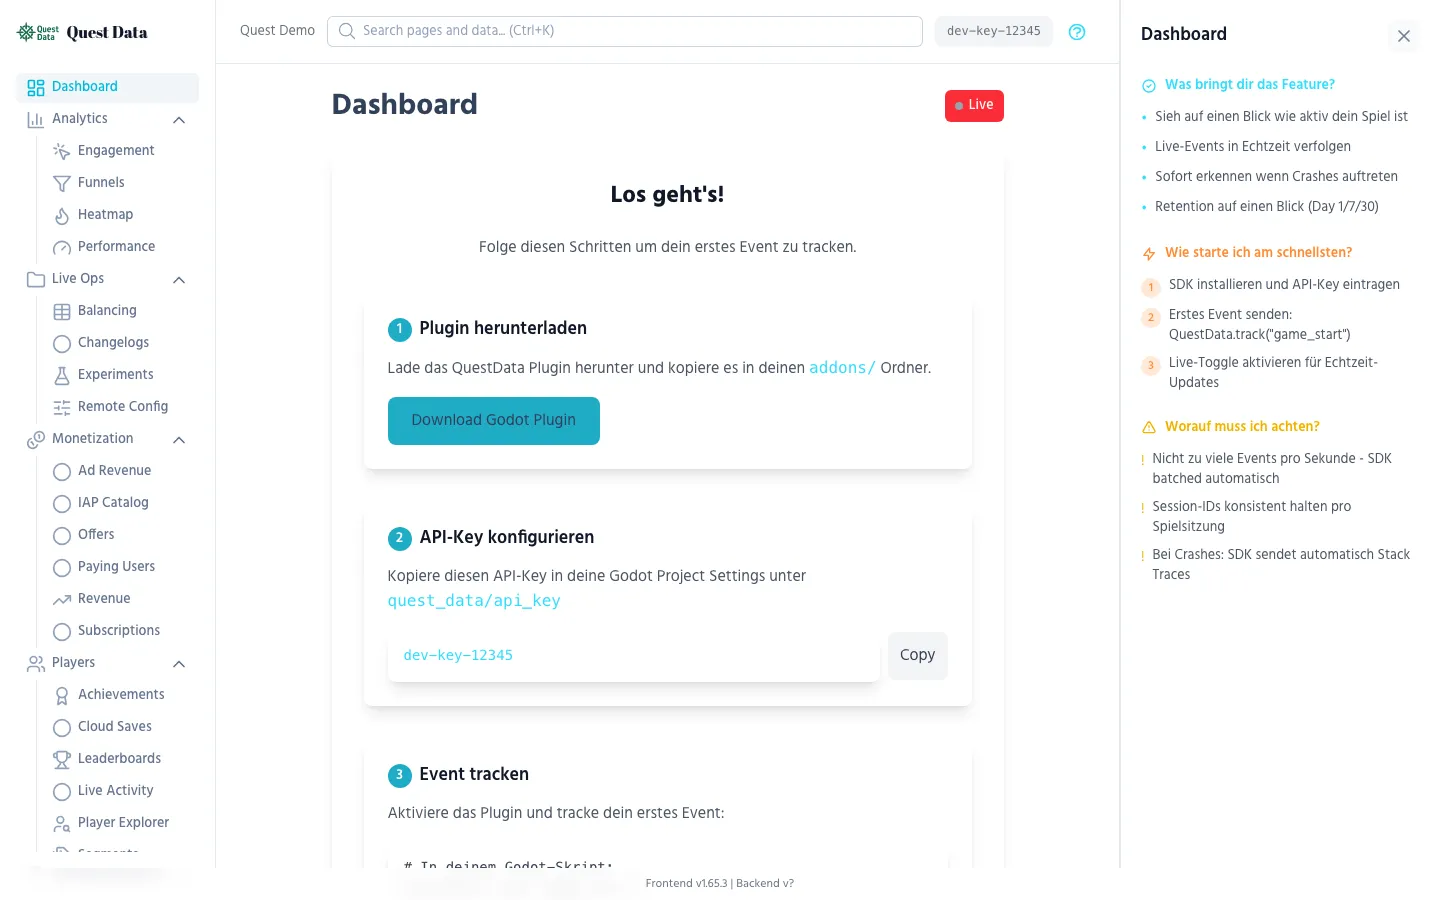
Dashboard Overview
Section titled “Dashboard Overview”The overview page is your daily pulse check. Open it every morning to see if your game is healthy.
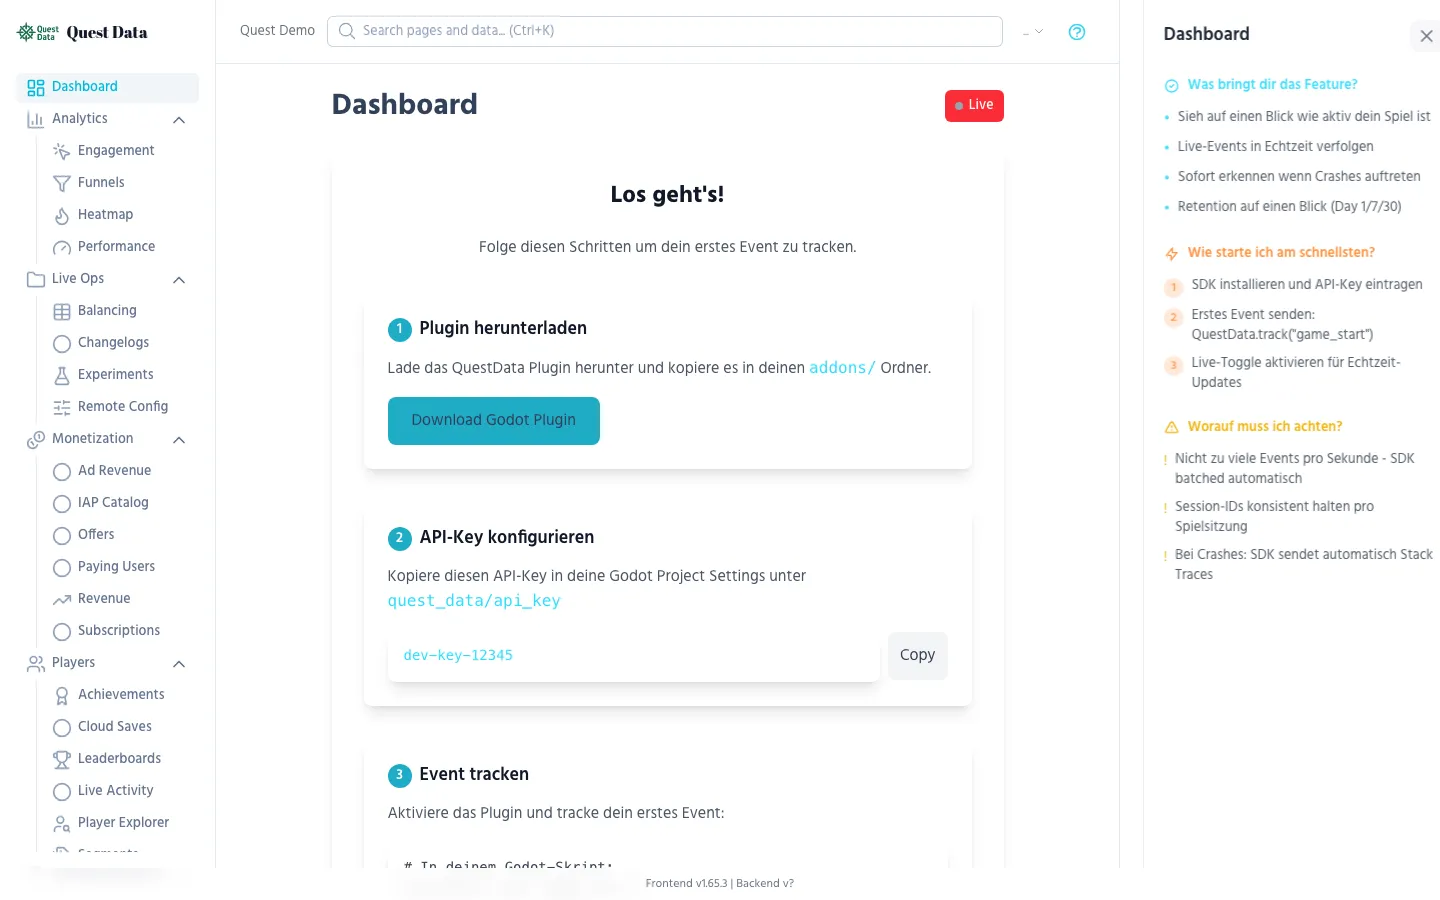
Key metrics at a glance:
| Metric | What it tells you | Healthy range |
|---|---|---|
| DAU (Daily Active Users) | How many unique players today | Growing or stable week-over-week |
| Sessions | How many times the game was opened | 1.5-3x your DAU (players return multiple times) |
| Avg Session Duration | How long players stay | 5-30 min for casual, 30-120 min for mid-core |
| Events | Total tracked events | Proportional to DAU |
The Live Feed at the bottom shows events arriving in real-time. Toggle Live to watch events as they happen — useful during playtests and launch day.
Retention
Section titled “Retention”Retention tells you how many players come back after their first day. It’s the single most important metric for a game’s long-term health.
How to read the retention table
Section titled “How to read the retention table”| Metric | What it means | Benchmark (casual mobile) |
|---|---|---|
| Day 1 | % of players who return the next day | 30-40% is good |
| Day 7 | % who return after a week | 10-15% is good |
| Day 30 | % who return after a month | 3-5% is good |
What to do with this data:
- Day 1 < 20%: Your first impression is bad. Fix onboarding, tutorial, or first 5 minutes.
- Day 1 good, Day 7 bad: Players like the start but run out of content. Add progression depth.
- Day 7 good, Day 30 bad: Long-term engagement loop is missing. Consider daily rewards, events, social features.
SDK integration
Section titled “SDK integration”Retention is calculated automatically from session_start events — no extra code needed. The SDK sends this event when the game launches.
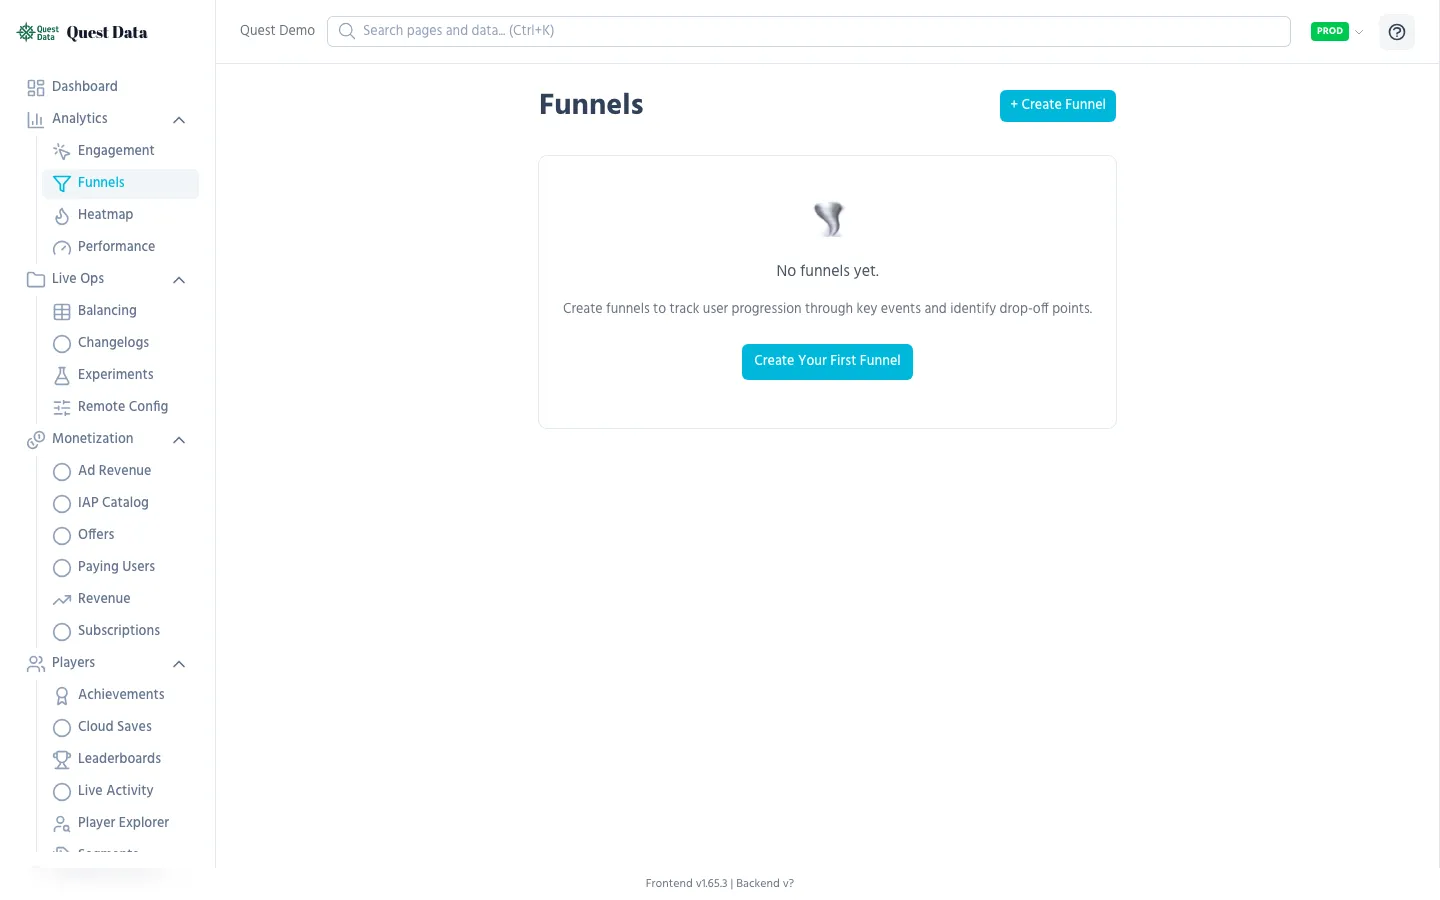
Funnels
Section titled “Funnels”Funnels show you where players drop off in a multi-step process. Perfect for tutorials, onboarding flows, or purchase journeys.
Example: Tutorial funnel
Section titled “Example: Tutorial funnel”Create a funnel in the dashboard with these steps:
tutorial_start— Player begins tutorialtutorial_move— Learns movement controlstutorial_combat— Learns combattutorial_complete— Finishes tutorial
If 1000 players start the tutorial but only 400 finish it, your funnel shows exactly which step loses the most players. Maybe 30% drop off at combat — that step is too hard or too boring.
SDK integration
Section titled “SDK integration”Track each funnel step as a separate event:
QuestData.track("tutorial_start")# ... player does the step ...QuestData.track("tutorial_move")# ... player does combat ...QuestData.track("tutorial_combat")# ... player finishes ...QuestData.track("tutorial_complete")See Event Tracking Reference for details.
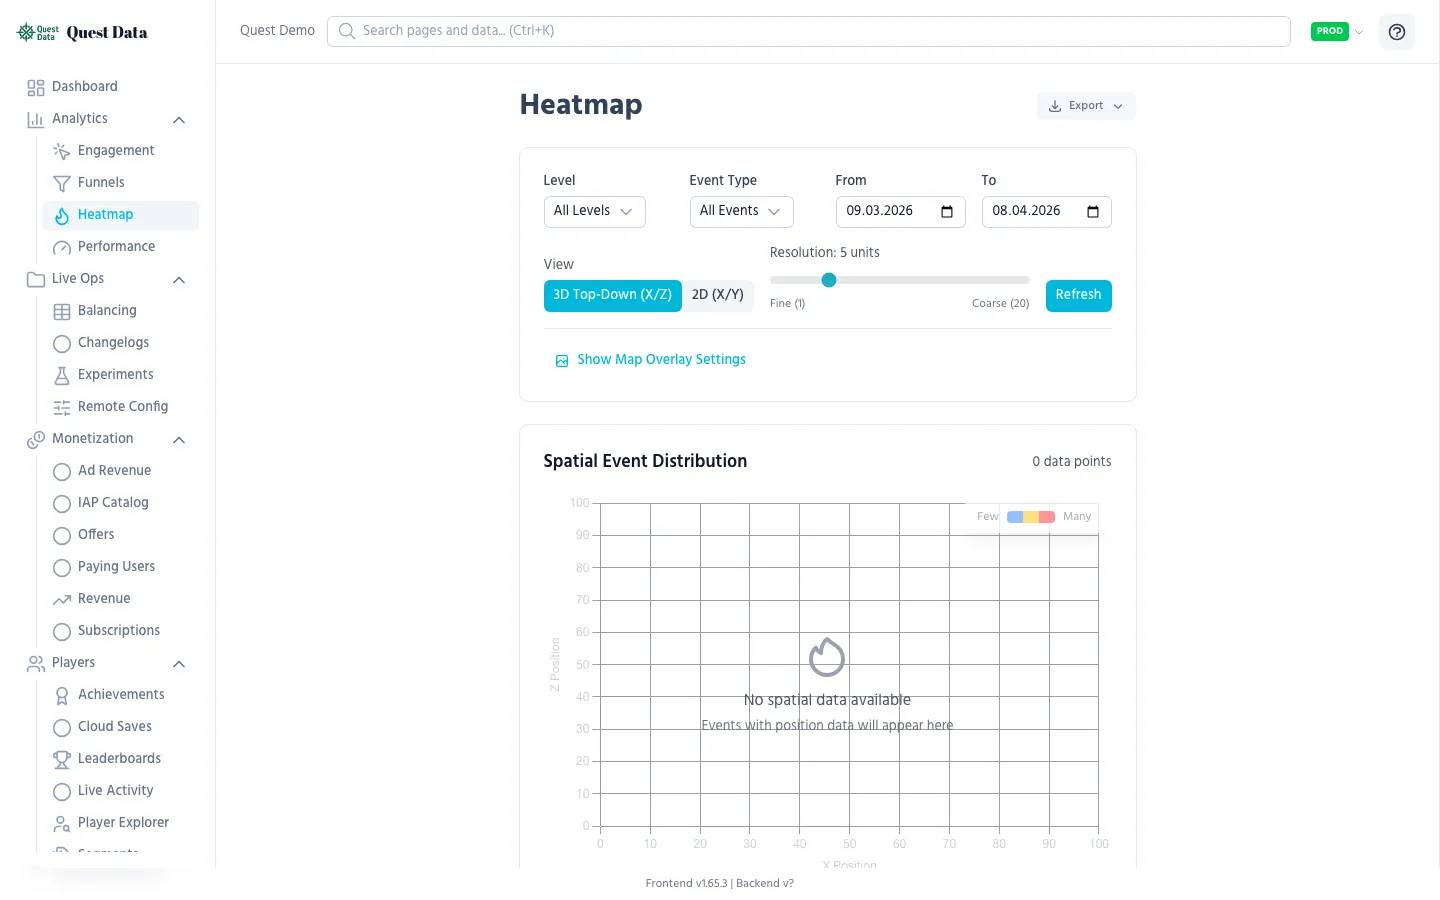
Heatmaps
Section titled “Heatmaps”Heatmaps visualize where things happen on your map — deaths, item pickups, player movement. Upload a level screenshot as background for spatial context.
Common use cases
Section titled “Common use cases”| What to track | Event | What you learn |
|---|---|---|
| Death locations | player_death | Where difficulty spikes are |
| Item pickups | item_pickup | Whether hidden items are found |
| Player movement | player_position | Which areas are explored |
SDK integration
Section titled “SDK integration”Pass a Node2D or Node3D as the third argument to track() and the SDK extracts coordinates automatically:
# Track death at the player's positionQuestData.track("player_death", {"enemy": "dragon"}, player_node)Engagement
Section titled “Engagement”Engagement tracking reveals which features players actually use — and more importantly, which ones they ignore.
What it shows
Section titled “What it shows”- Most used features — ranked by interaction count
- Dead features — things nobody touches (candidates for removal or redesign)
- Usage patterns — which screens lead to which actions
SDK integration
Section titled “SDK integration”Use the dedicated UI tracking function or the zero-code QuestButton node:
# Code-based trackingQuestData.track_ui("main_menu", "play_button", "click")QuestData.track_ui("shop", "sword_item", "view")
# Or attach QuestButton script to any Button node (zero code)
Performance
Section titled “Performance”Performance telemetry tracks FPS, memory usage, and device hardware across your player base. Find out which devices crash, which GPUs drop frames, and whether your latest update made things worse.
What it shows
Section titled “What it shows”| Metric | What it tells you |
|---|---|
| FPS distribution | How many players are below 30 FPS |
| Memory usage | Who’s running out of RAM |
| Device breakdown | Which phones/GPUs/OS versions have problems |
| Crash rate per device | Which hardware causes the most crashes |
SDK integration
Section titled “SDK integration”The SDK automatically tracks a performance_sample event periodically. No extra code needed for basic telemetry. For custom performance tracking:
# Track a specific performance concernQuestData.track("lag_spike", { "duration_ms": 500, "scene": "boss_arena", "active_entities": 200})Next Steps
Section titled “Next Steps”- SDK Event Tracking — All event types and properties
- SDK Progression — Level tracking with automatic duration
- Dashboard Reference — Detailed page-by-page documentation
- Best Practices — What to track and what not to