Remote Debugging
Debugging production issues is painful. Players can’t send you log files. Crashes happen on devices you don’t own. “It works on my machine” doesn’t help when 500 players are stuck. Quest Data gives you remote eyes into your game — logs, crash reports, pre-crash telemetry, and alerts.
What You’ll Learn
Section titled “What You’ll Learn”- How to send logs from your game to the dashboard
- How to track crashes with automatic stack traces
- How to use the Flight Recorder (60s of pre-crash data)
- How to set up alerts for error spikes
- How to configure log levels for production vs. development
Remote Logging
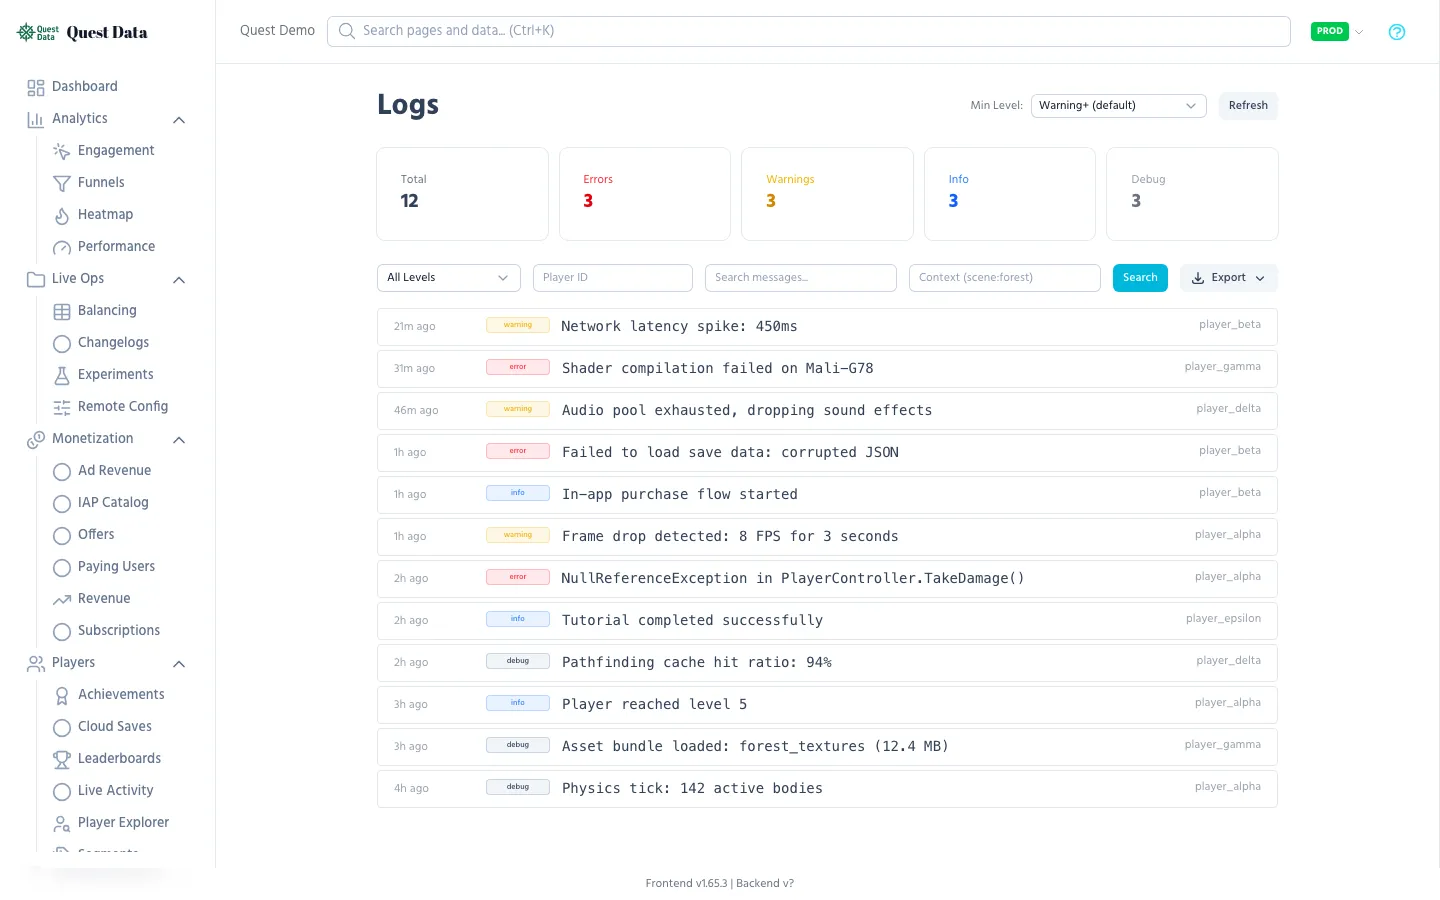
Section titled “Remote Logging”Send debug, info, warning, and error logs from your game to the dashboard. View them in real-time without asking players for anything.
- Player reports a bug? Search their logs by player ID
- Mysterious crash? Filter by
errorlevel and see what happened - Performance issue? Check
warninglogs for slow operations - Production debugging? No need to ship a debug build
SDK integration
Section titled “SDK integration”# Log at different levelsQuestData.log_error("Save file corrupted", {"path": "user://save.dat"})QuestData.log_warning("Low memory: 45MB free", {"scene": "boss_arena"})QuestData.log_info("Player reached level 5", {"playtime": 1200})QuestData.log_debug("Physics tick: 142 bodies", {"sleeping": 58})Logs are batched (50 per batch, every 10 seconds) and persisted to disk if offline. They’re not lost even if the game crashes.
Dashboard features
Section titled “Dashboard features”| Feature | What it does |
|---|---|
| Level filter | Show only errors, or only warnings |
| Player filter | Search logs from a specific player |
| Full-text search | Find logs containing specific words |
| Context search | Filter by structured context fields (JSON) |
| Export | Download logs as CSV or JSON |
See Remote Logging SDK Reference for full details.
Error Tracking
Section titled “Error Tracking”Track crashes and errors with automatic stack traces. The SDK captures the full GDScript call stack and groups similar errors together.
SDK integration
Section titled “SDK integration”func load_config(path: String) -> Dictionary: var file = FileAccess.open(path, FileAccess.READ) if file == null: QuestData.track_error("ConfigLoadFailed", "Cannot open: " + path) return {}
var data = JSON.parse_string(file.get_as_text()) if data == null: QuestData.track_error("ConfigParseFailed", "Invalid JSON in: " + path) return {} return dataWhat you get
Section titled “What you get”- Error grouping — Same errors are grouped by
error_name - Occurrence count — How often each error happens
- Stack trace — Full call stack + short snippet
- Device info — OS, game version
- Flight Recorder data — 60 seconds of telemetry before the crash
See Error Tracking SDK Reference for full details.
Flight Recorder
Section titled “Flight Recorder”The Flight Recorder is a black box for your game. It continuously captures FPS, memory usage, active scene, and recent events — keeping the last 60 seconds in a circular buffer. When track_error() is called, this data is attached to the error.
What it captures every second
Section titled “What it captures every second”| Data | Why it matters |
|---|---|
| FPS | Was the game lagging before the crash? |
| Memory (MB) | Was memory running out? |
| Active scene | Which scene was loaded? |
| Recent events | What did the player do right before? |
No code needed
Section titled “No code needed”The Flight Recorder runs automatically. Just use QuestData.track_error() and the data is included.
Alerts
Section titled “Alerts”Get notified when something goes wrong — before players complain. Set up Discord or email alerts for error spikes.
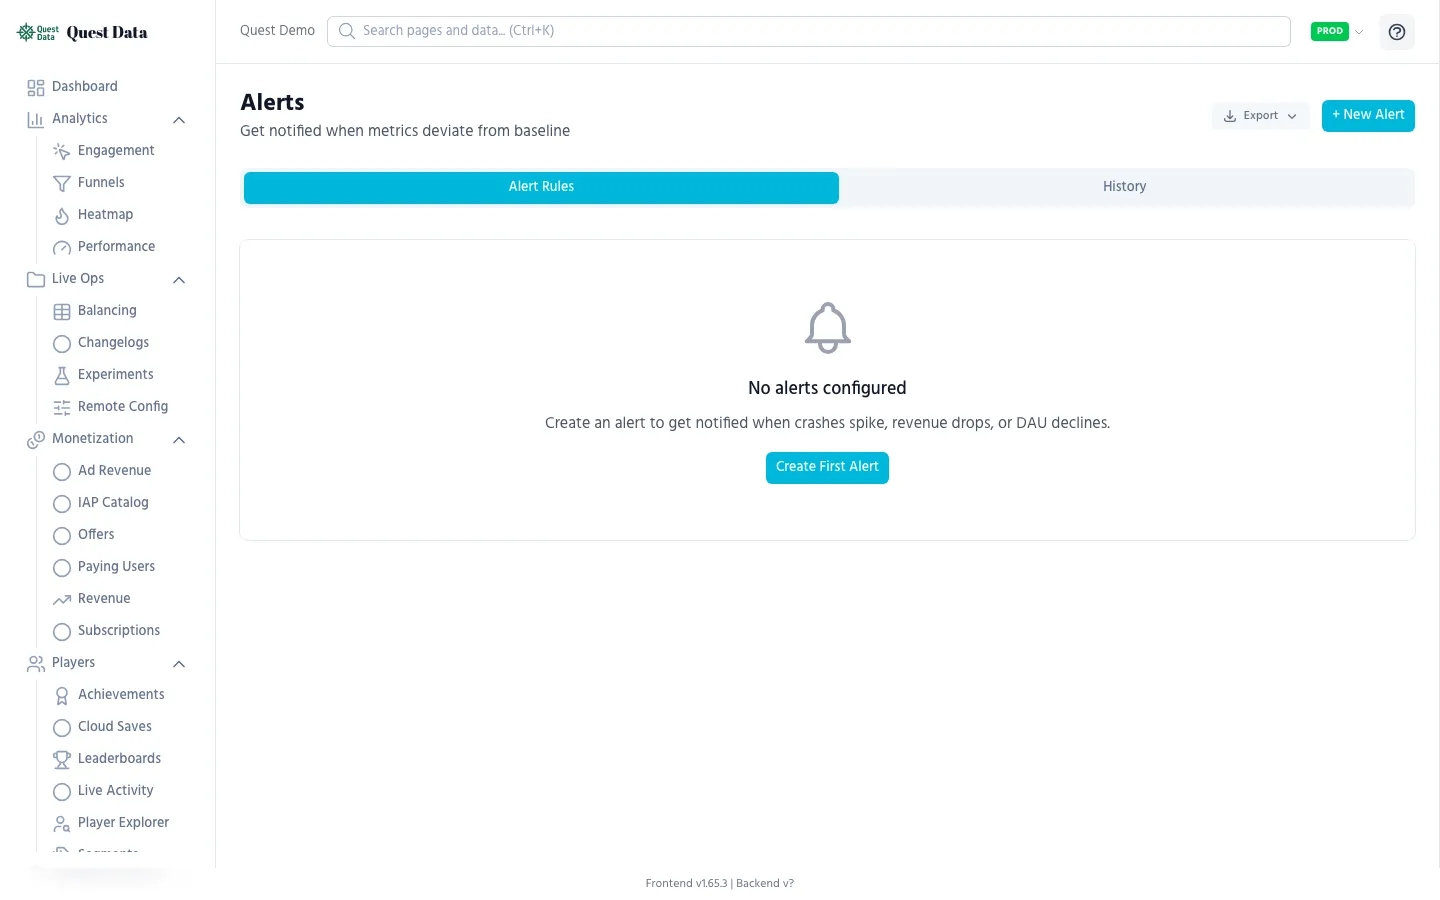
Setting up
Section titled “Setting up”- Go to Configuration > Alerts
- Click New Alert
- Choose type: Log Error Spike
- Set threshold (e.g. 200% — alert when errors double vs. baseline)
- Add your Discord webhook URL or email
Available alert types
Section titled “Available alert types”| Alert Type | Triggers when |
|---|---|
| Crash Spike | Error events increase significantly |
| Log Error Spike | Log errors/warnings spike above baseline |
| Revenue Drop | Daily revenue drops below threshold |
| DAU Drop | Daily active users decline |
| Retention Drop | Retention metrics fall |
Log Level Configuration
Section titled “Log Level Configuration”Control which logs reach the server to save bandwidth and storage. In production, you probably only want errors and warnings. During a debugging session, you can temporarily enable debug logs.
Setting up
Section titled “Setting up”- Go to Configuration > Logs
- Set the minimum log level (Debug / Info / Warning / Error)
- The SDK automatically filters on the client side
| Level | Production | Debugging |
|---|---|---|
| Error | Always on | Always on |
| Warning | Recommended | Always on |
| Info | Optional | On |
| Debug | Off | On |
Per-level retention
Section titled “Per-level retention”Logs are automatically cleaned up based on level:
| Level | Retention |
|---|---|
| Debug | 7 days |
| Info | 14 days |
| Warning | 30 days |
| Error | 90 days |
Next Steps
Section titled “Next Steps”- Remote Logging SDK Reference — Full API with REST endpoints
- Error Tracking SDK Reference — Stack traces and flight recorder
- Alerts Dashboard Reference — Alert configuration details
- Analytics Guide — Understand player behavior